
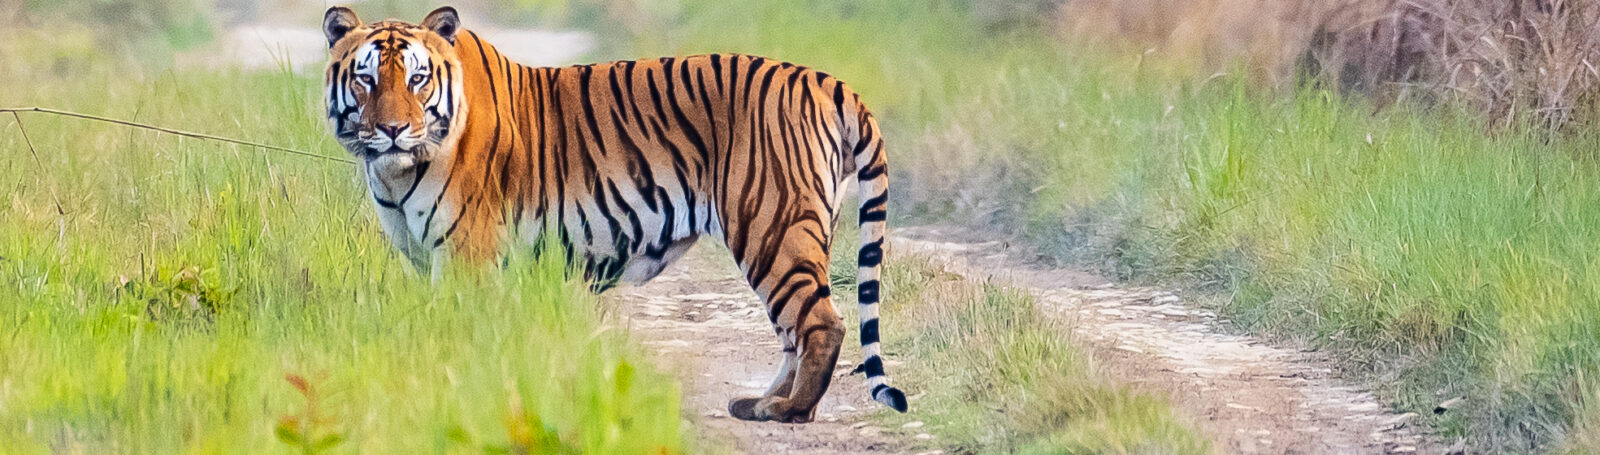
Tiger prey: Bottom-up vs. top-down control of deer in Bardia NP (WP8)
To gain a better understanding of the relative importance of food availability, climate/weather conditions, and risk constraints (predation risk and human disturbance) in shaping the distribution, habitat utilization, and activity of tigers and their main prey species within Bardia National Park, vertical and horizontal camera networks are used. Similarly, GPS collaring of spotted deer is used to assess the distribution, habitat use, movement pattern and foraging behaviour of deer. Official record on human – tiger conflicts are also used to assess the dynamics of human – tiger interaction.
A vertical camera trap network comprising 50 units with a 1.5 km * 1.5 km grid size was deployed from 2022 until July 2024. These camera traps were distributed across the Karnali flood plain of BNP to cover different habitats (Shorea forests, riverine grasslands, riverine forests, mixed forests and grassland). These hyper fire cameras employed passive infrared motion detectors and nighttime infrared illuminators, positioned at a height of 7-8 meters in trees, the cameras provide an image of 15 m2 by facing downwards. Additionally, temperature and humidity loggers were integrated into 10-12 cameras within the existing network of 50. These loggers recorded data pertaining to black-globe temperature, ambient temperature, and relative humidity. Regular monitoring of cameras was conducted every month. Similarly, a local weather station was established in BNP to measure the local temperature, rainfall and relative humidity. Local weather data is also collected from the Chisapani weather station of the Department of Hydrology and Meteorology (DHM).
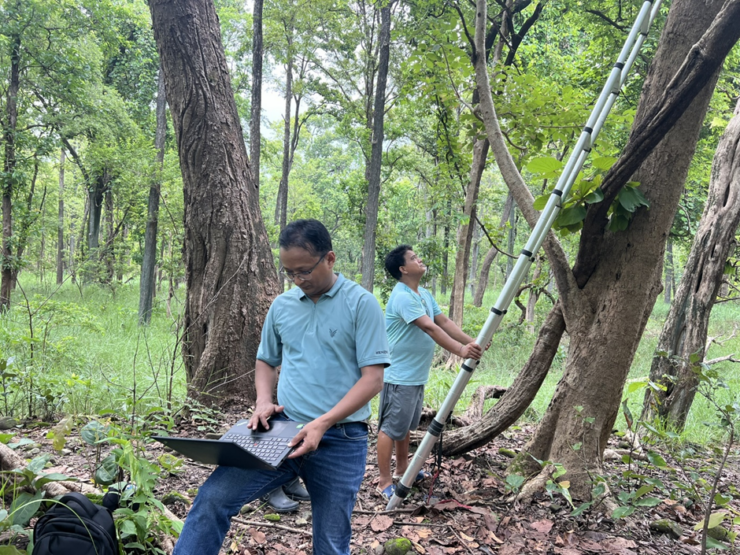
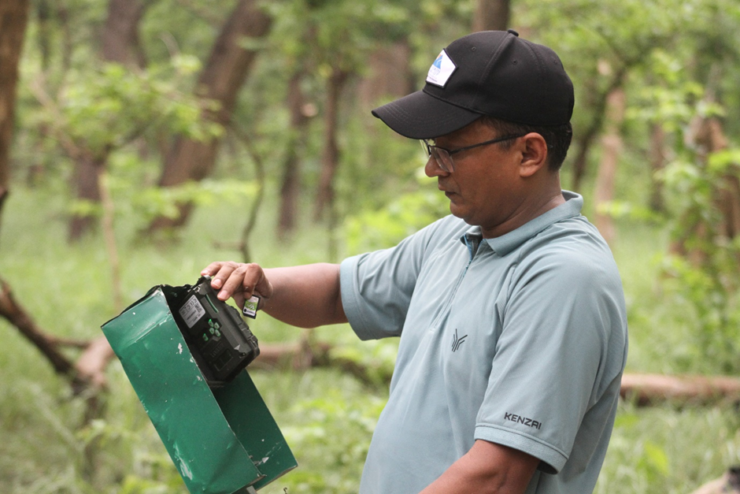
Moreover, data from horizontal camera traps of Bardia National Park utilized in the National Tiger Surveys of 2018 and 2022 were taken from the Department of National Parks and Wildlife Conservation (DNPWC) to understand the distribution and habitat use of tigers. The survey employed a grid of 418 units, each measuring 2 km * 2 km, for camera trap placement. For each station, a pair of cameras was stationed facing each other at a height of 45 cm above the ground, typically on trees or posts flanking forest trails or roads. The distance between the two cameras ranged from 6-8 meters, and a standard sampling period of 15 days was maintained for cameras within each grid.
The camera traps photos are processed using CamtrapR Package. Based on camera traps photos processed by using CamtrapR Package, activity patterns of tiger and deer are calculated. These patterns are calculated by use of kernel density estimates with overlaps package in which activity levels are plotted against time of the day, month and season to depict the activity patterns of each species.
For seasonal analysis, the dataset is divided into three distinct seasons: the cool dry season (November to February), the hot dry season (March to June), and the wet monsoon season (July to October). All the data analysis and visualizations are done with R. Tigers and sambar show a cathemeral activity, and hog deer show a diurnal activity pattern. In contrast, muntjac and spotted deer display crepuscular activity patterns. Similarly, tigers and deer show substantial overlap in activity patterns.
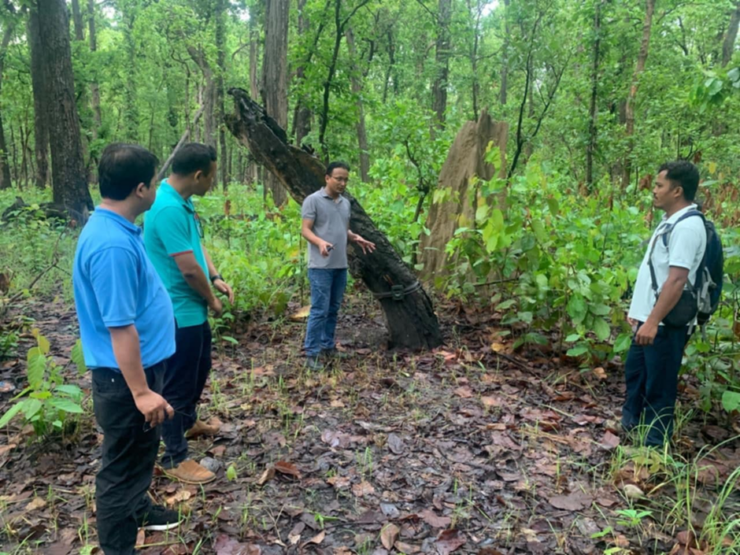
During the field work period, coordination and collaboration has been done with Department of National Parks and Wildlife Conservation (DNPWC) and Bardia National Park Office, National Trust for Nature Conservation (NTNC), Bardia Conservation Program, WWF Nepal and ZSL Nepal.
Data on human – tiger conflicts mainly on human death and injuries by tiger attacks from 2019 to 2024 are collected from BNP Office to assess the dynamics of human-tiger conflicts (HTC) in and around BNP. We documented the type of conflict (death or injury), incident period (month, season and year), time of incidents (day or night), age of victims, location of conflict (forest, farmland and settlement), habitat types (BNP, Buffer zone or Buffer zone community forest, Khata corridor and other community forests), and victim activities during the incident. For seasonal analysis, we grouped the data into winter (Dec-Feb.), spring (March-May), summer (June-August), autumn (Sep-Nov). We integrated GIS-data on landscape configuration, camera trapping data to understand spatial tiger population and official human casualty report detailing human contextual factors.
Further, 10 spotted deer were captured and fitted with GPS collars to assess the distribution, habitat use, home range, movement pattern, and foraging behaviour in BNP. Monitoring of collared spotted deer is ongoing. Similarly, data collection from a local weather station continued until November 2025.
PhD candidate Bishnu Shrestha uses his experience gained from his research in his daily job at DNPWC where he has excellent insight in the challenges that Nepal is facing on nature conservation not only for the tigers and the Terai, but also for other ecosystems and individual animals.